AI Studio
Debug your chatbot flows by testing runs, inspecting variables, and reviewing runtime events.
AI Studio is the best place to debug a run by:
- Inspecting state in Variable Logs (read-only snapshot of what the runtime “knows”)
- Tracing execution in Logs (runtime events + payloads so you can see what fired and why)
1. Variable Logs
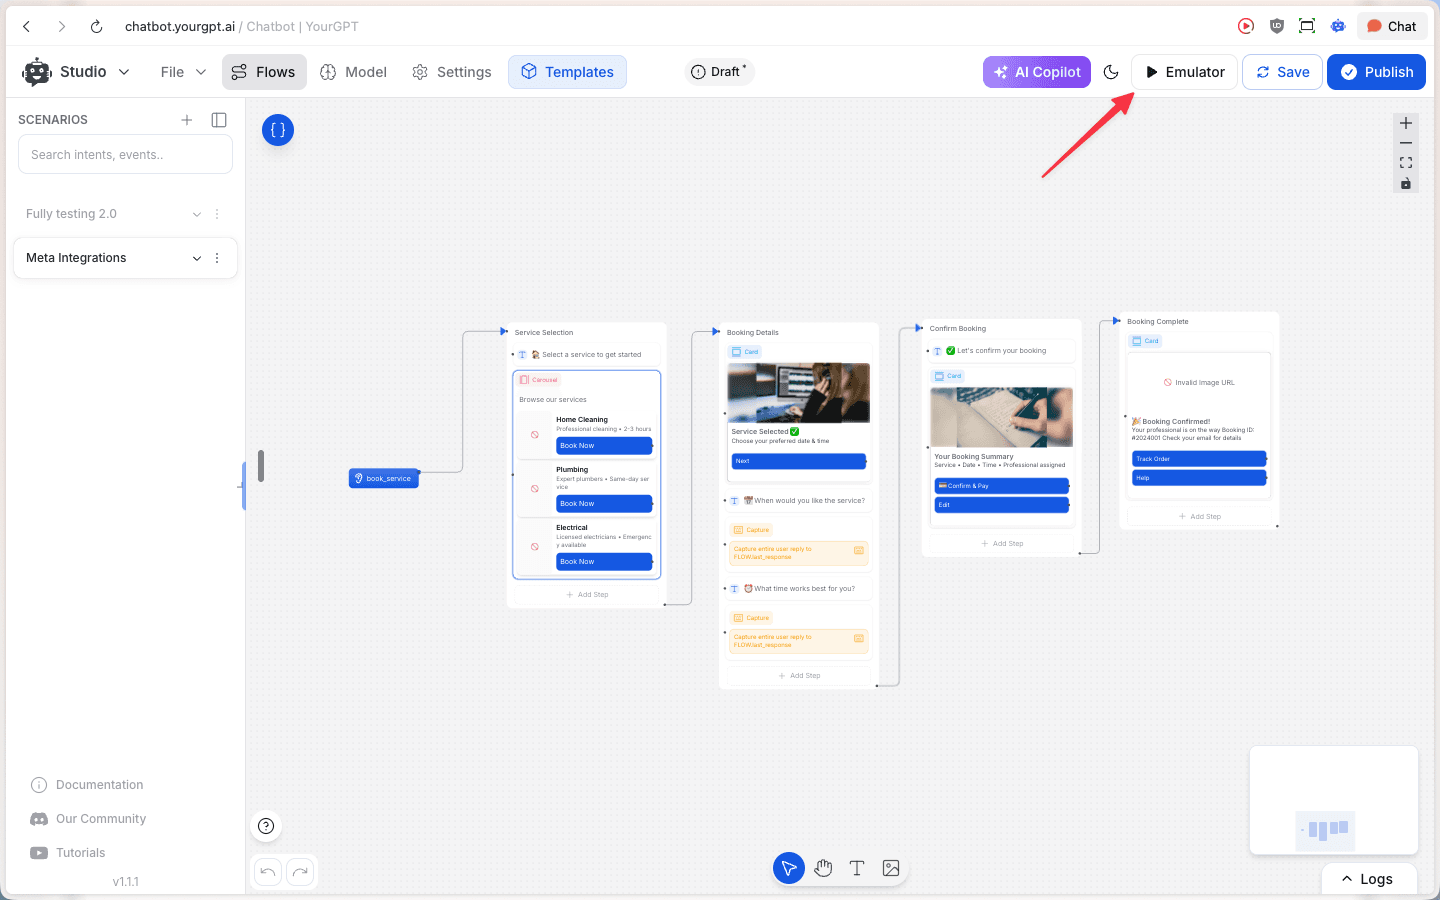
Open the emulator from the top-right Emulator button.
From inside the emulator, open Variable Logs .
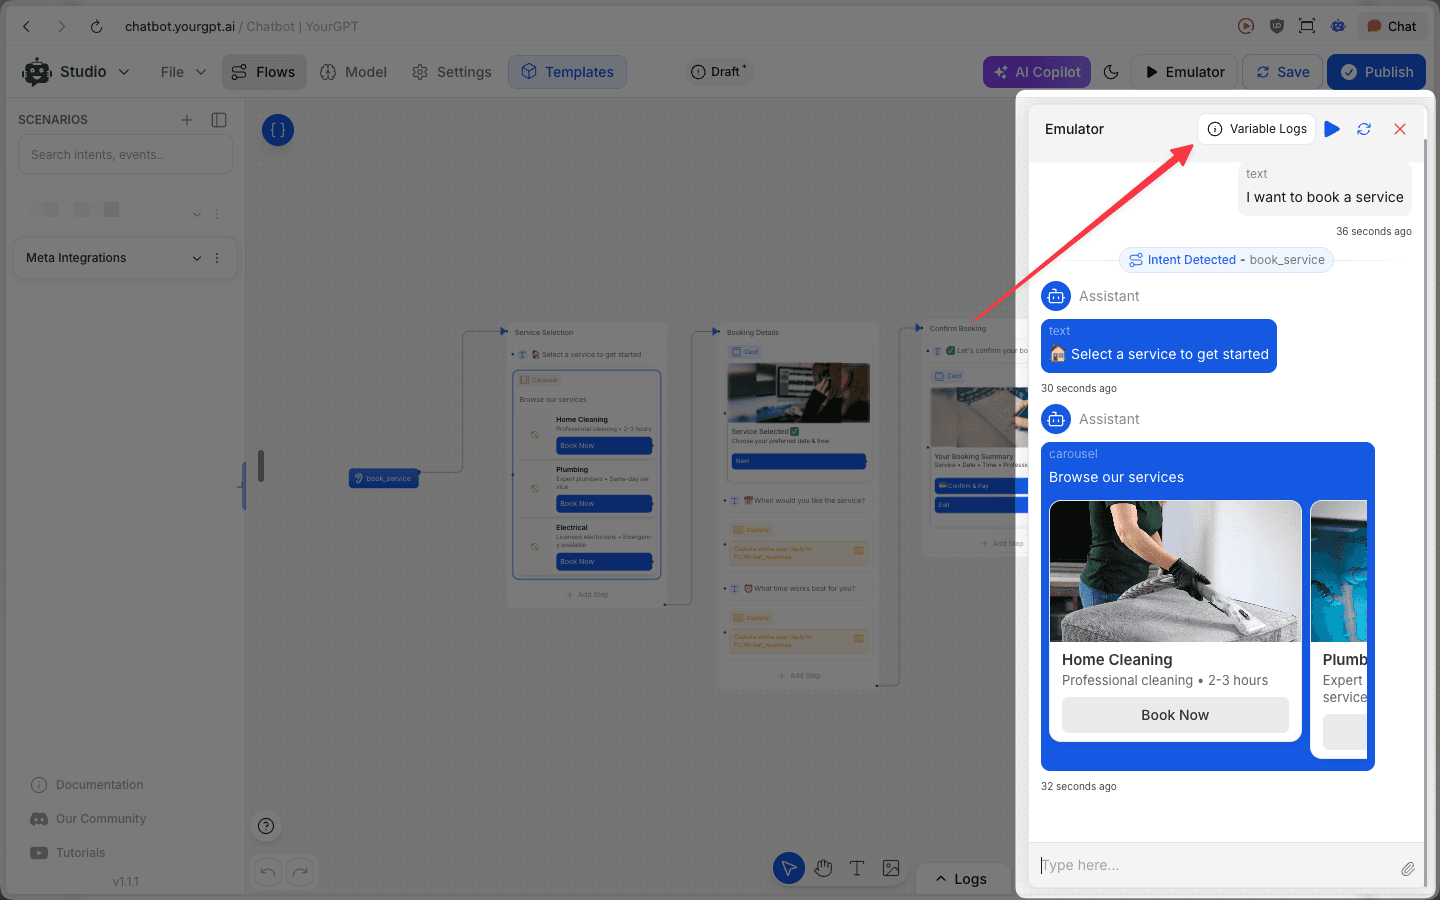
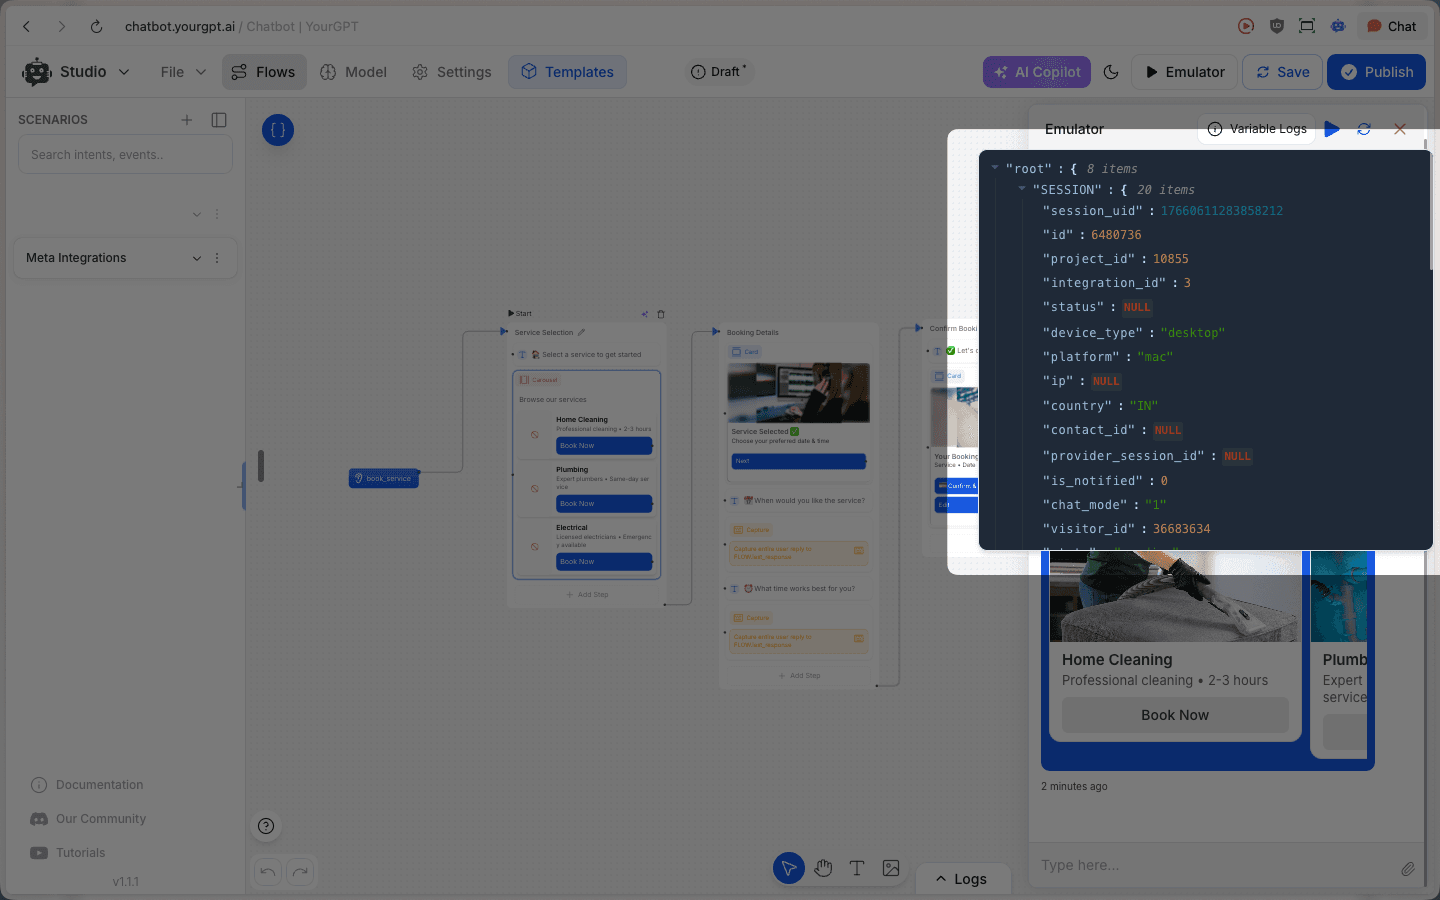
Variable Logs are for read-only inspection during debugging. Use them to confirm the run context, identifiers, and environment signals the runtime is using.
Common things to look for:
Project + environment
Confirm the project identifier (and environment/workspace if applicable) matches what you’re testing.
Session identifiers
Copy session/run identifiers so you can correlate them with Execution Logs and other debugging tools.
Visitor identifiers
Verify visitor/user identifiers and related session IDs match the conversation you expect.
Client context
Check device/platform and browser/app signals—useful for debugging channel-specific behavior.
Locale/geo
Confirm country (and other locale signals, if present) to debug localization and routing.
What to debug with Variable Logs:
Variables not set
Confirm the variable exists, the value is what you expect, and whether it changes after the step that should set it.
Wrong user/session
Verify visitor/session identifiers match the conversation you’re testing.
Environment mismatch
Confirm you’re testing against the expected project/environment.
Tips
- Session details (FLOW object): in the emulator, you can open session details (Info / “i”) to view session metadata and the
FLOWobject (variables + current stored values). This view may not update live—close and reopen to refresh. - Variable structure may differ: the
FLOWobject you see in logs/session details can be structured differently than how variables are referenced inside Studio—use the Variable Logs as the source of truth for what’s stored in this run.
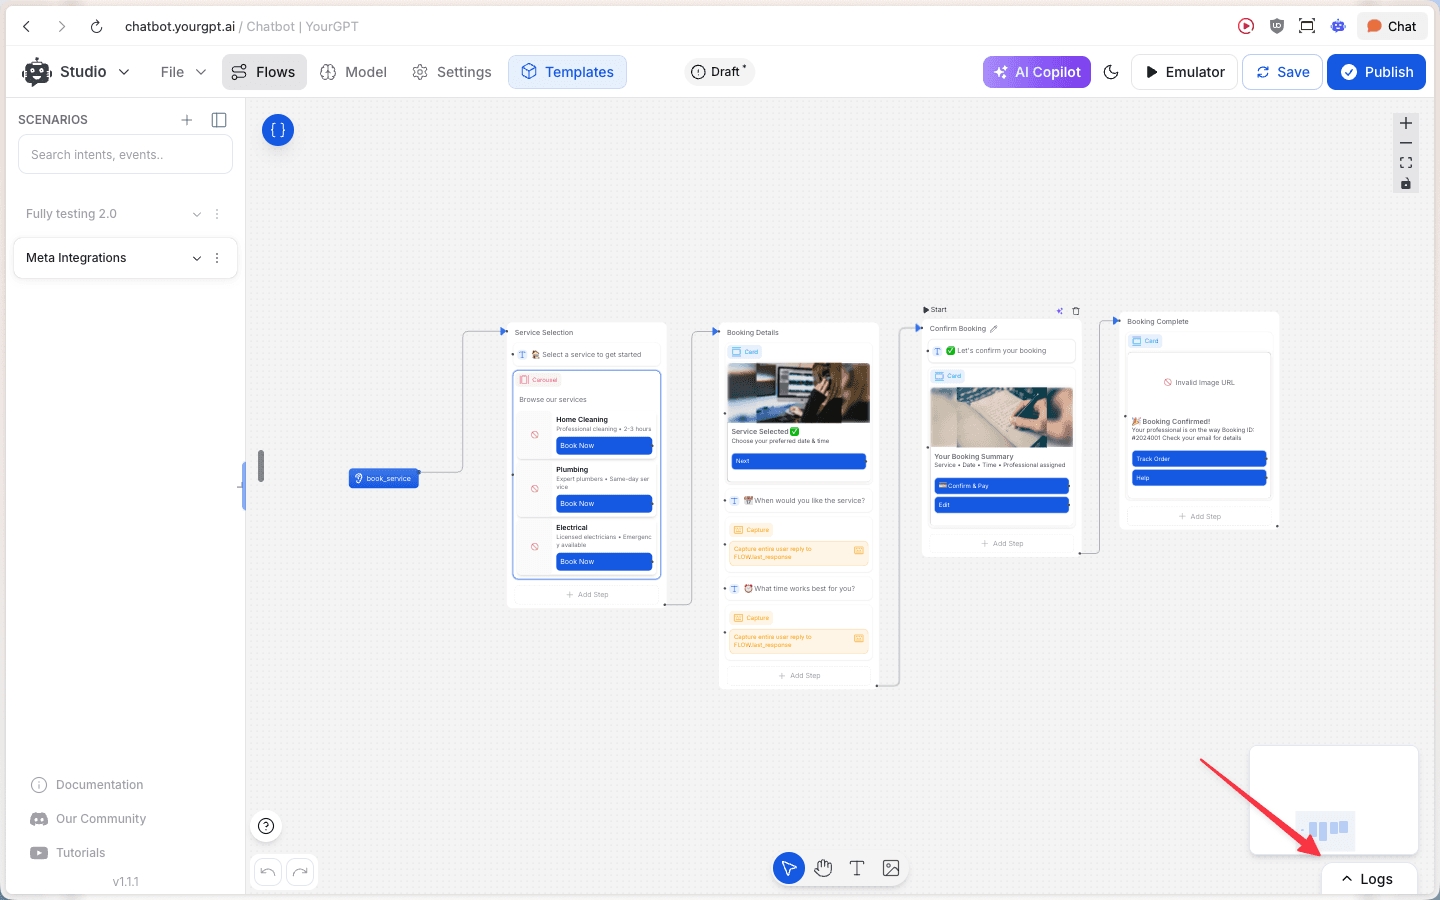
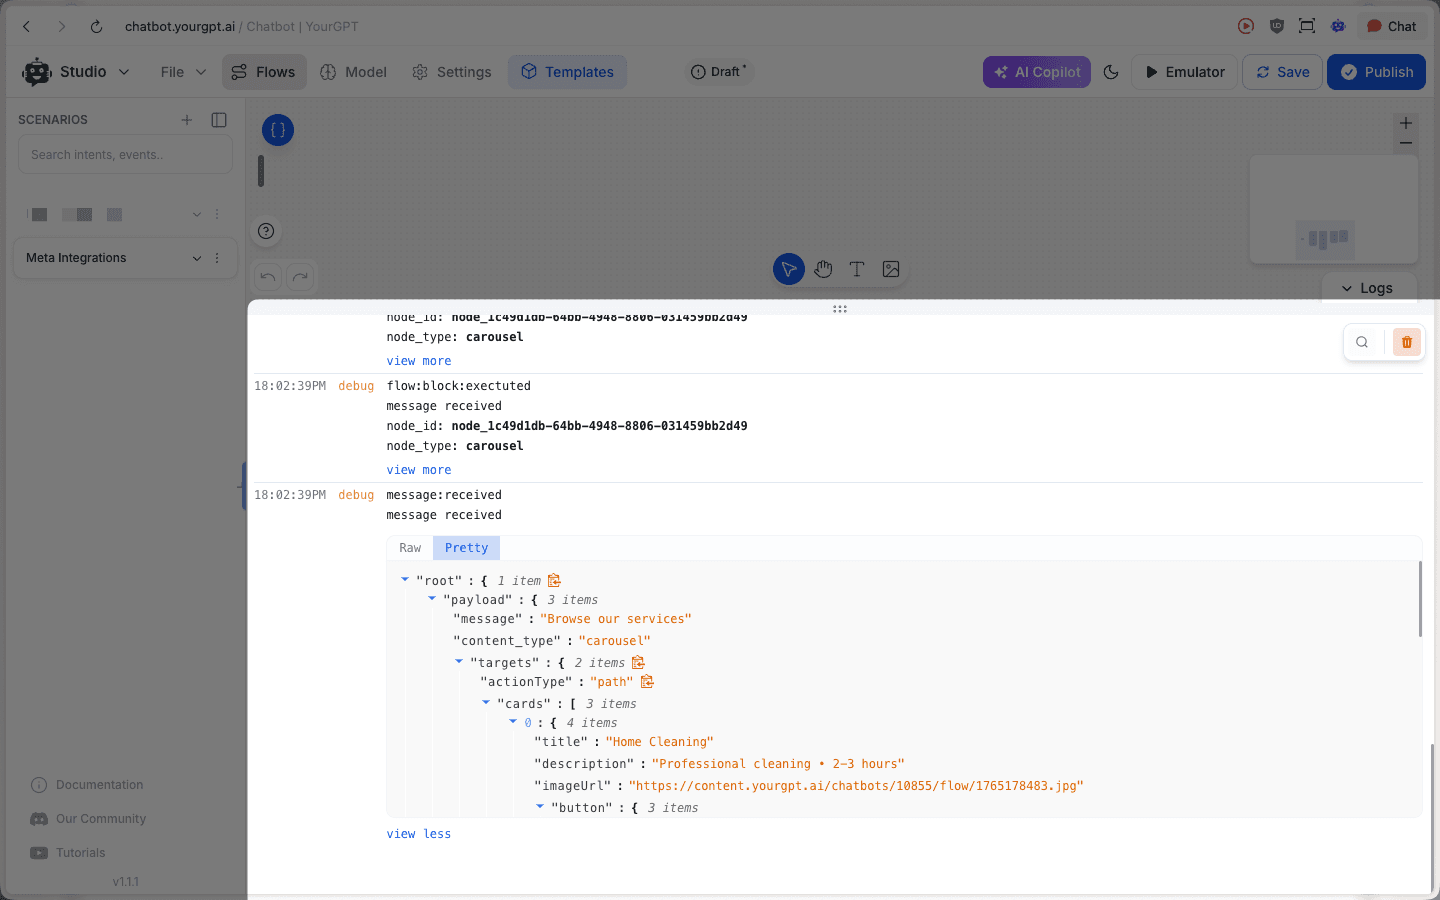
2. Execution Logs
Open the Logs drawer using the bottom-right Logs toggle.
Logs show runtime events emitted while your flow runs (for example message:received and flow:block:executed). Each entry typically includes:
- Event name: what happened (e.g. a message was received, a block executed)
- Node metadata:
node_id/node_typeso you can pinpoint where it occurred - Payload: the event data (what was received/sent, what inputs were used, what outputs were produced)
In addition to message and block execution events, Execution Logs commonly help you spot:
- Intents and events detected during the conversation
- Variable changes as the flow updates state
- API calls and responses (when your flow calls external services)
- Errors/warnings that explain why a step failed
Use Raw/Pretty to switch between the raw event JSON and a more readable view when inspecting payloads.
What to debug with Logs:
Message not sending
Do you see message:received? Do you see the expected flow:block:executed events after it?
Wrong card/content
Inspect the event payload (Pretty view) to confirm exactly what content was generated/sent.
Branching seems wrong
Find the first unexpected block execution and compare its payload/inputs to what you expected.
Cross-reference node IDs
Each block/step/node has a unique identifier; the selected node’s ID is often reflected in the browser URL. Match that ID with node_id in Execution Logs to pinpoint exactly where an event came from.
Common debugging workflows
- Message not sending → Check Logs for
message:receivedand whether the expected nodes executed. - Wrong card/content → Inspect the event payload in Pretty view to see what was actually sent.
- Variables not set → Check Variable Logs and compare values before/after the step where they should change.